Case study · 01 / 09

Vision Track

AI fleet intelligence platform

One web hub for camera-equipped fleets: live tracking, journey analysis, in-cab video, AI object detection and a chat assistant that answers questions about the whole fleet.

  • AI
  • Real-time
  • Video
  • Maps

Partner

VisionTrack · Autonomise.ai

Industry

Fleet safety & telematics

Platform

Web app (SPA)

Our role

Frontend engineering

The product

What it does

VisionTrack Hub (the Autonomise.ai brand) brings everything a fleet safety team needs into a single-page app: vehicles moving on a live map, day-by-day journey analysis, footage from on-board cameras — live and recorded — AI that spots objects and risky situations on video, dashboards for safety, risk and fuel, and 36 ready-made reports.

Our part

What we built

We work on the frontend of a large product: roughly 2,400 TypeScript files, 35+ Redux slices and every page lazy-loaded. That covers real-time maps fed over WebSockets, in-browser video streaming with low-latency HLS and DASH, the Lumiere AI assistant, configurable dashboards and per-customer theming — plus migrating the whole ecosystem of four repositories from React 18 to React 19.

Under the hood

The hard parts

  1. 01

    Live map over two WebSocket hubs

    Vehicle and driver positions stream through SignalR into Redux. Auto-reconnect, OIDC token refresh and keep-alive keep the map live; markers rotate with heading and animate between updates.

  2. 02

    Video in the browser

    Shaka Player, low-latency hls.js, dash.js and in-browser transmuxing with mux.js. Multi-view streams up to 3×3 cameras, merges channels of one device into a single request and cancels stale requests with AbortController.

  3. 03

    AI that explains what the camera saw

    Bounding boxes with class and confidence on event frames, model-written descriptions, and admin screens to define what the AI should look for — down to custom LLM prompts the model can draft itself.

  4. 04

    A fleet chat assistant

    Lumiere answers questions about drivers, safety and costs with Markdown tables, keeps paginated history, rates answers optimistically and guards against race conditions when users switch conversations fast.

  5. 05

    Our own map library and design system

    HERE Maps wrapped in a separate Vite-built npm package (clustering, animated markers, polylines, geofences) and a component library themed per organisation with contrast checks.

The outcome

Live position, video and AI insight for every vehicle in one app — in 12 languages and each customer’s own colours.

Inside the product

16 screens, explained

Demo data · click any screen to enlarge

01

Live fleet tracking

Positions arrive over SignalR into Redux. Markers turn with the direction of travel; hovering shows address, speed, the latest camera still and shortcuts to live stream, footage and events. Fleet tree with online / idle / offline filters on the left.
02

Journeys and speeding

The day’s journeys with the route drawn as a HERE polyline. Over-limit stretches turn red, start and finish get their own markers, and the side panel lists time, distance, average speed, addresses and events.

03

Journey timeline and route replay

An interactive timeline of the whole day, a chart of vehicle speed against the road’s speed limit, and route replay — play, pause, scrub and change speed while a marker drives the GPS trace.

04

Event with dash-cam video

Footage with a telemetry overlay (VRN, driver, location, speed, GPS), the event on a map, tabs for details, AI insights and speed & G-sensor charts — and requesting more video straight from the device.

05

AI object detection

Bounding boxes with class and confidence drawn on the camera frame (car 0.95, building 0.95, street light 0.90), with a description written by the model underneath.

06

AI-detected events on the road

Events raised by camera models — overhead power lines here — pinned to where they happened, with the GPS accuracy circle and category toggles.

07

Lumiere AI assistant

A slide-out chat available on every page, with suggested questions grouped by drivers, safety, fleet and costs. Access follows the organisation’s licence.

08

Answers as tables

Model answers render as Markdown with GFM tables. Each shows the date range it analysed, with copy and rating — ratings update optimistically and roll back on error.

09

Driver coaching recommendations

An analysis of driver behaviour with concrete coaching steps. Request IDs make retries safe and stop stale answers when users hop between conversations.

10

Configurable dashboard

Drag and resize widgets (react-grid-layout) and the layout is saved — KPIs for events to review, devices and diagnostics, plus recharts for top-event vehicles and speeding.

11

Risk management

A grid of risk categories — collisions, fatigue, distraction, phone use, seat belts, smoking — each with a count, a trend sparkline and a colour-coded risk level.

12

Geofencing

Polygons and circles drawn on the map and grouped into categories, tied to rules and alerts when a vehicle enters or leaves.

13

Media library

Every camera recording as a thumbnail with event type, category, processing status and location — with adjustable tile size, channel layout and export.

14

Multi-view live stream

Live view of many cameras across many vehicles in 1×1, 2×2 or 3×3, growing the grid when it overflows. Fullscreen and idle detection included.

15

Reporting

A catalogue of 36 reports with PDF preview. Parameters cover period, units, time zone and a virtualised picker of vehicles, fleets or drivers — and reports can be scheduled.

16

Teaching the AI what to look for

Admins define objects to detect — potholes, graffiti, roadworks, fly-tipping — with synonyms, event types, a confidence threshold and whether to raise an event or just record the detection.

Stack

Frontend

  • React 19
  • TypeScript 5.7
  • Redux Toolkit 2
  • React Router 6
  • styled-components 6
  • react-intl (12 languages)

Real-time & media

  • SignalR
  • HERE Maps
  • Shaka Player
  • hls.js
  • dash.js
  • mux.js

UI & data

  • recharts
  • react-grid-layout
  • @dnd-kit
  • framer-motion
  • react-markdown + GFM
  • oidc-client-ts

Tooling

  • Webpack 5 (SRI, PWA)
  • Vite (libraries)
  • Jest 30
  • ESLint
  • SonarQube

Next case

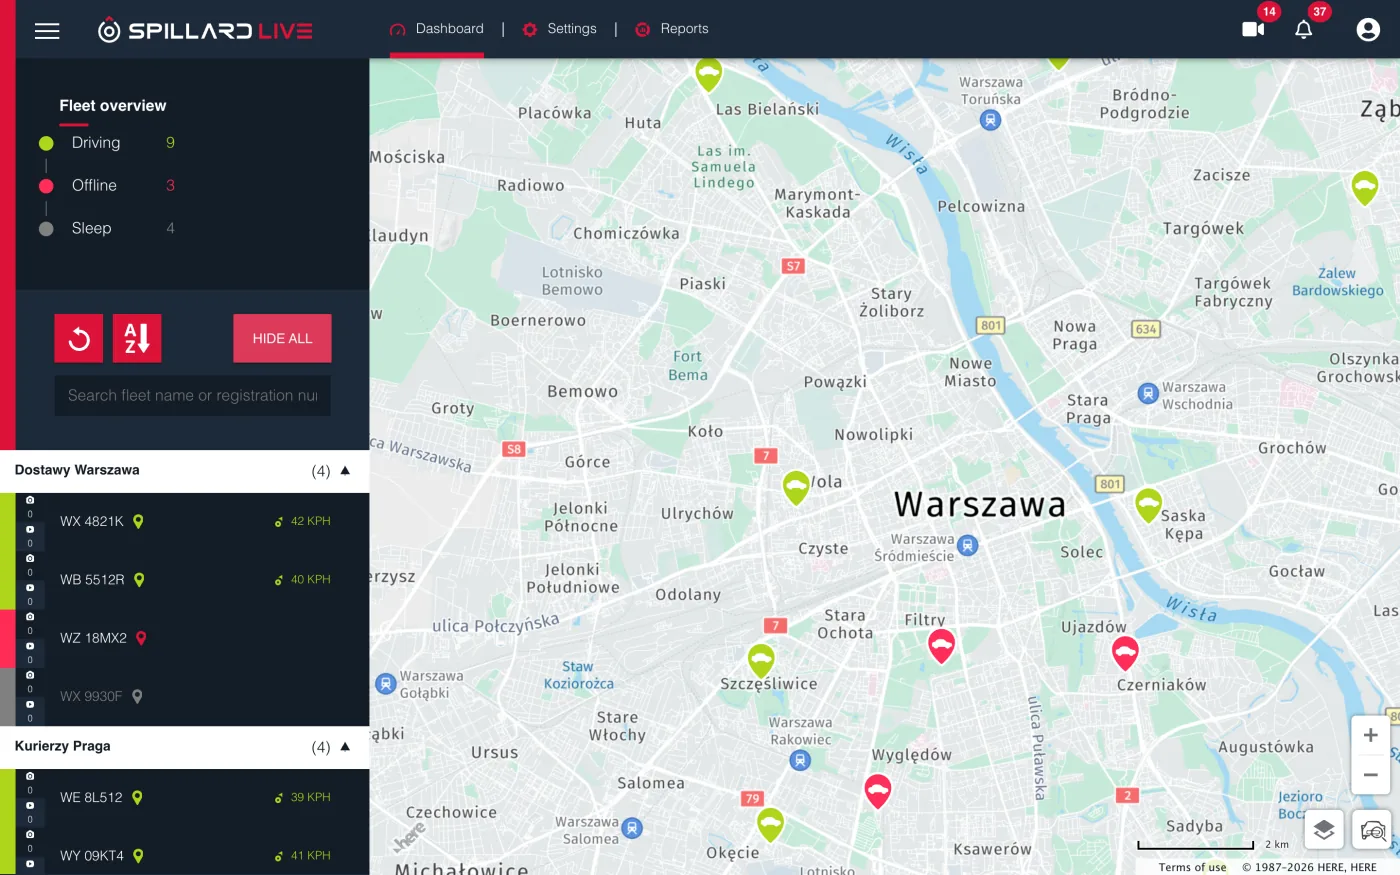
Spillard LIVE →

Real-time fleet telematics

Want a product
like this?

Get a free estimate